Workforce and Skills Measurement Guidance

Some of my favorite problems to tackle are those of measurement. For instance, how do we think about social norms, but in a quantitative way? And, is it even possible to create a universal (or even multiple-country) indicator for women’s empowerment (been thinking about this one A LOT lately). Over the past year, I’ve also spent a lot of time thinking about how to measure skills, and specifically, how USAID should measure changes in skills as the causal effect of its workforce development programs all over the world.

Turns out, this question is not even remotely trivial, but I’m very excited to share some recently released guidance on exactly how USAID plans to incorporate some of the latest and greatest advances in measuring many (but not all) types of skills in its youth programming around the world. This is officially joint work with Catherine Honeyman of World Learning (a delightful collaborator if I do say so myself), but also benefited enormously from a wide consultative process with stakeholders across USAID in DC and around the world as well as implementing partners and peer research organizations working on issues of skills development for youth.

As background, USAID works with youth programming in 60 countries and workforce development programs in 30 countries. All of these programs are working to impart technical, vocational, social-emotional, digital, reading, and mathematics skills (and more) to various program participants. And all of them (yes ALL of them) are required to report back to USAID on their project in various ways.

Alongside, there has been a ton of work recently on how to measure various skill development. As we learn more about the importance of “skills” to labor market outcomes like perseverance or grit and hard-working or dependable, the more necessary it becomes important to measure them in a way that has meaning across different spaces. After lengthy reading and consultation, we identified two skills or groups of skills that were selected to be “standard foreign assistance indicators”–percent individuals with improved soft skills and improved reading skills–and three that have been designated “supplemental indicators,” percent of individuals with improved math skills, percent with digital literacy skills, and percent passing a context-relevant technical skills assessment. More precise wording is in the table, with a much longer justification in the how-to note itself.

Screen Shot 2019-10-30 at 5.47.13 PM

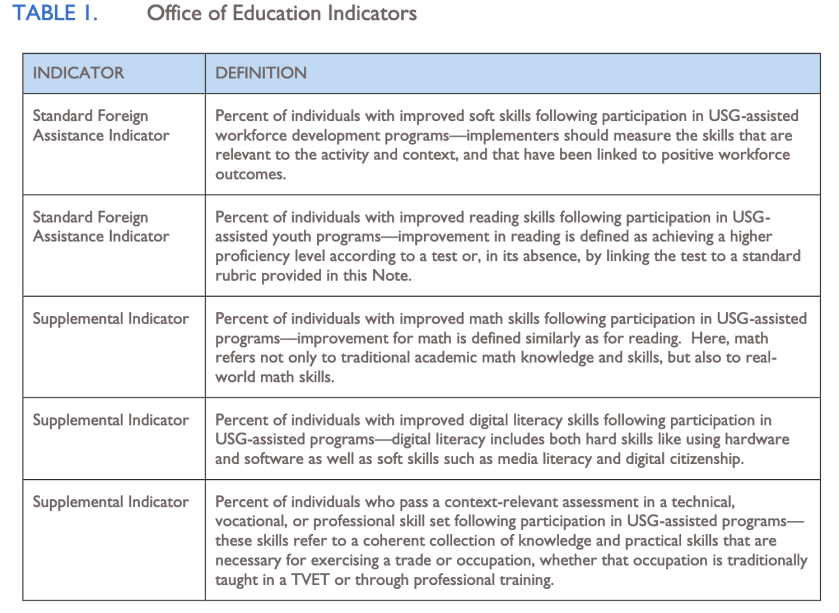
In short, though, it’s really tough to standardize measures across all those countries and all those contexts.

I won’t lie to you; we did not find all the answers. However, I think the note provides an excellent jumping off point for ongoing conversations on how to measure important workforce development programming outcomes and highlights important gaps in our understanding of how to measure these outcomes in a consistent and useful way. Please reach out if you have ideas!

We also put together a fun (measurement is FUN, I SAY!) FAQ that you can read here.

Paper Acceptance Day!

When I was working for myself, I had a lot of conversations with development practitioners that started with an element of intuition, and ended with one of frustration:

“We think X thing is happening, but we’re not really sure…” or “we think we could do this thing we’re doing better…” and then “…but we don’t have the technical skills on staff,” or “…we’ve asked like 85 consultants to do this and no one wants to help us.”

Usually, these requests came in fields that I (at the time) was certainly no expert in. Livelihoods analysis, tertiary child protection systems, community-based disaster recovery management programming, etc. They almost always meant diving into new literatures and exploring problems of measurement and data use in ways that were novel and particular and had to somehow hew to the very real limitations faced by those implementing these programs: namely, time, but also expertise and sheer number of people.

These were also the projects that I have loved taking on, taking ideas that are firmly based in practitioner experience and helping make sense of how to use data and econometrics and innovative measurement and descriptive tools in ways that are practical and implementable. Getting to work with inquisitive and innovation-oriented development professionals is one of the things I love best about my job.

I also love when we get to share these projects. I’m super pleased to announce that one such project (or rather, our write-up of the work) has been accepted at World Development!

With Richard Barad, a GIS specialist, and Chris Hillbruner, then Deputy Chief of Party for FEWS NET, we piloted a method to use large-scale household and remote-sensed data to describe livelihoods in a way that was compatible with participatory methods and comprehensible to practitioners in the field. Quick summary:

  1. Collect HEA-compatible variables from large scale household data like the LSMS from the World Bank (agricultural activities, livestock ownership, etc.)
  2. Spatially interpolate these data!
  3. Identify relevant remote-sensed data that pertains to livelihoods (soil quality, ground cover, distance to markets, passable roads, etc.)
  4. Export all the data to grid squares and perform principal components analysis and cluster analysis
  5. Make pretty maps! Go Forth! Discuss! Use to understand food emergencies!

LSMS_Nigeria_National_Map-1

I stress that it’s both because a lot of people we spoke with are pushing forward some neat and innovative methods to do something similar, but in a way that was difficult to implement. What we propose is certainly still in beta, but we think can be put in place quickly to inform emergency situations and to validate other types of data collection.

Abstract below, and a yet-to-be-finalized copy is here and tweetstorm is here.

Understanding livelihoods patterns is a key component of food security and poverty analysis. The Household Economy Approach (HEA) is a leading method of conceptualizing, organizing, and analyzing information on livelihoods systems that is widely used within the food security analysis community. This approach is typically informed by data collected using qualitative methods. However, the increasing availability of large-scale household survey datasets presents an opportunity to explore the degree to which these data can be used to strengthen HEA analysis. Here, we present the results of a novel pilot study that uses large-scale household survey data to create livelihoods products for Nigeria, using a combination of spatial interpolation, principal component analysis, and cluster analysis. We show how these techniques can leverage existing data to create low-cost maps of quantitatively described livelihoods that are stable over time and conceptually consistent with products derived using traditional methods.  We also outline future research for how to incorporate these outputs into practitioner analysis.

*Paper acceptance day was actually yesterday